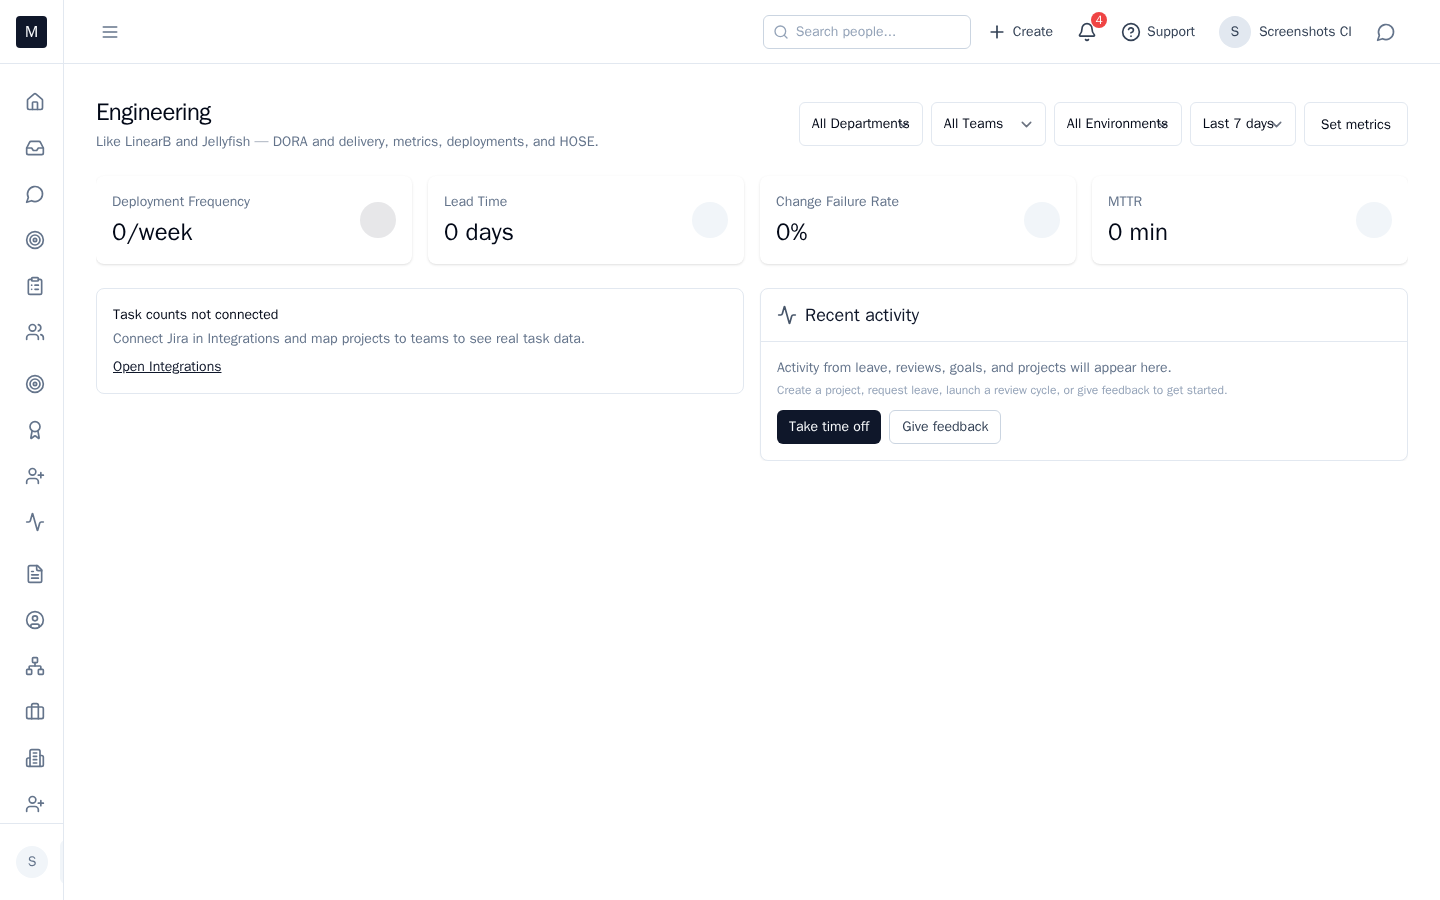
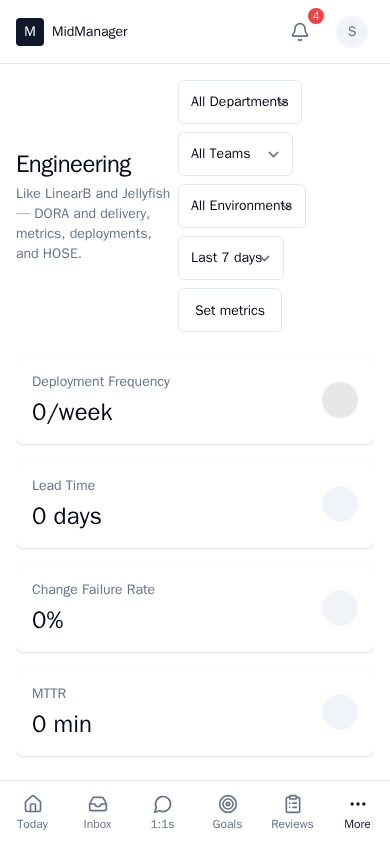
View PR & delivery signals
PR latency, throughput, and other engineering signals surface so you can spot trends and act — no dashboard digging.
The problem
You need delivery health — PR flow, latency, bottlenecks — without jumping between dashboards. Data is scattered and hard to turn into action.
Mid-Manager (and HOSE when enabled) surfaces engineering signals in one place so you see what’s changing and what to do next.
What you see
Signals like “PR latency spike” or “throughput trend” appear when you configure them. They use metadata from your stack (GitHub, Jira); we never touch source code. You see the signal on Today or in an engineering view, with context so you can dig in or delegate.
What to do
Open the engineering view to see the data. Use it in 1:1s or team syncs to discuss bottlenecks, WIP, or process. HOSE adds AI recommendations when enabled; the same signals feed both.
Example
PR merge time has increased for the backend team. The engineering signal appears on your view. You open it, see the trend, and in the next team sync you agree to limit WIP and focus on finishing reviews. You acted on the signal instead of finding out in a post-mortem. Outcome: delivery and process improve; one place for the engineering leadership view.
See it in action
Try the interactive demo, book a walkthrough, or request early access.